Condensed SRECNP
The Statement of Revenues, Expenses, and Changes in Net Position (SRECNP) presents operating and non-operating revenues and expenses for UC Davis campus and UC Davis medical Center. The SRECNP indicates why the net position has increased or decreased during the fiscal year. The information provided in this report is for the fiscal years beginning July 1 and ending June 30.
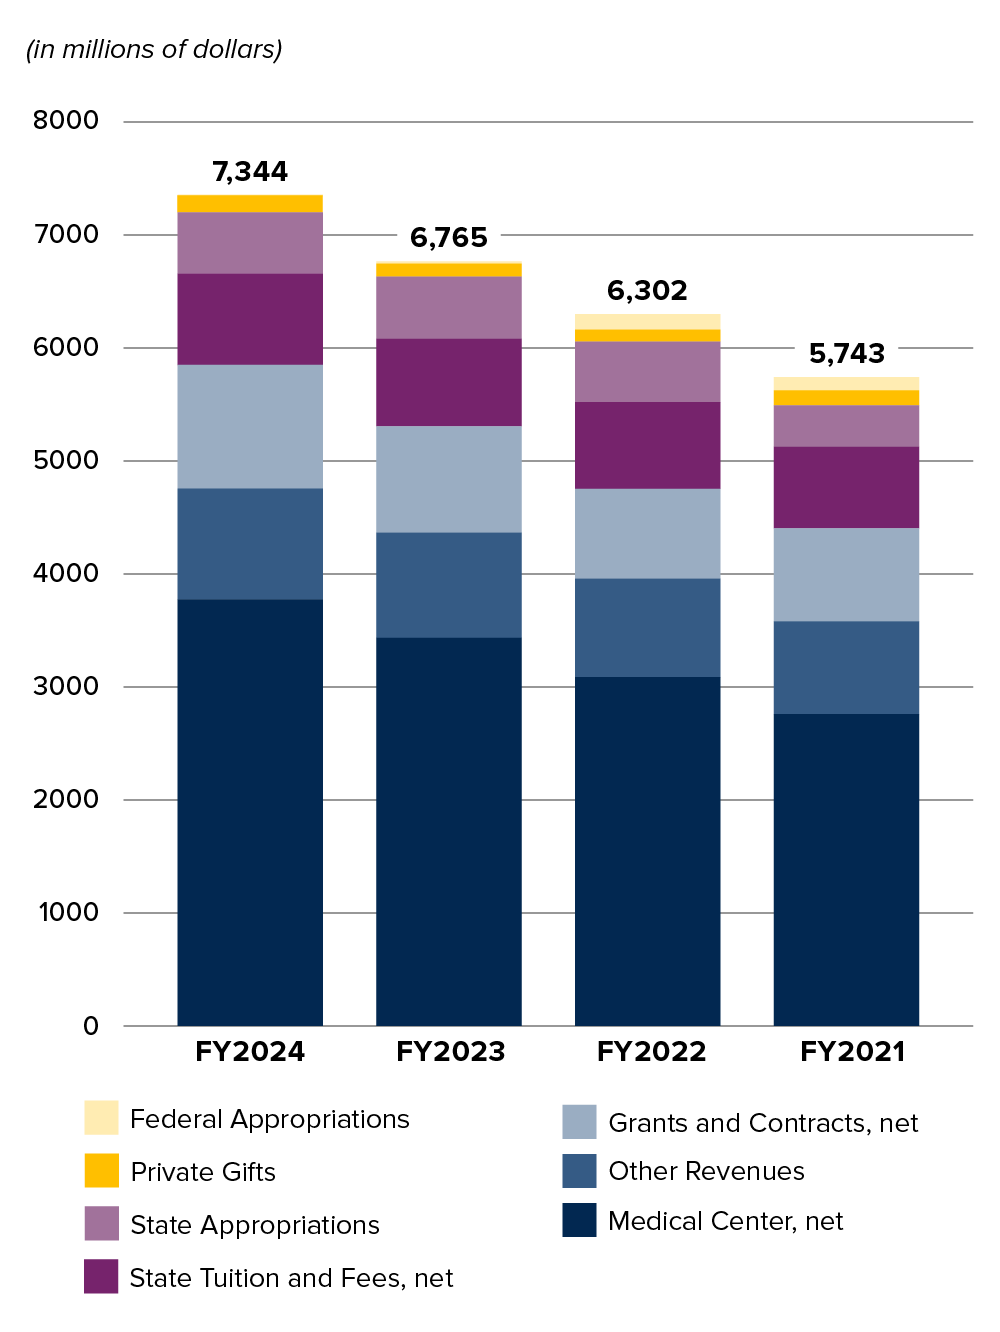
Operating revenues for UC Davis grew from $6.8 billion in 2023 to $7.3 billion in 2024. Expenses increased from $7.1 billion in 2023 to $7.5 billion in 2024. The tiles within this page provide additional detail about the increases.
NOTE: The reported financial information in this report, while not separately audited, is prepared from the official University of California records and accounts which are maintained in accordance with the Governmental Accounting Standards Board (GASB). For more information, please refer to the University of California's Annual Report.
| (in millions of dollars) | FY 2024 | FY 2023 | FY 2022 | FY 2021 | |
|---|---|---|---|---|---|
| REVENUES | Student tuition and fees, net | 813 | 775 | 768 | 722 |
| Grants and contracts, net | 915 | 875 | 813 | 762 | |
| Federal Pell Grants | 61 | 55 | 57 | 58 | |
| Medical Center, net | 3,780 | 3,431 | 3,088 | 2,759 | |
| Private Gifts | 143 | 115 | 102 | 133 | |
| State Appropriations | 540 | 547 | 536 | 367 | |
| Federal Appropriations | 1 | 21 | 142 | 117 | |
| Other Revenues | 1,090 | 945 | 795 | 823 | |
| Total | 7,344 | 6,765 | 6,302 | 5,743 | |
| EXPENSES | Compensation Expense | 5,128 | 5,076 | 4,702 | 3,955 |
| All Other Operating Expenses | 2,390 | 2,063 | 1,894 | 1,748 | |
| Total | 7,518 | 7,138 | 6,596 | 5,703 | |
| OTHER INCOME (EXPENSE) | 52 | (87) | (339) | 292 | |
| OTHER CHANGES IN NET POSITION | (17) | 115 | 115 | 348 | |
| INCREASE (DECREASE) IN NET POSITION | (140) | (346) | (518) | 680 | |
| NET POSITION, BEGINNING OF YEAR | (2,008) | (1,662) | (1,143) | (1,824) | |
| NET POSITION, END OF YEAR | (2,148) | (2,008) | (1,662) | (1,143) | |
Revenues
UC Davis receives income from a diverse set of resources. Operating revenues include: student tuition and fees, contracts and grants, UC Davis Medical Center, auxiliary enterprises, educational activities and other operating revenue. Revenue classified as non-operating by GASB that are key to the university's operations include private gifts, investment income, Pell Grants, and state educational appropriations.
| FY 2024 | FY 2023 | FY 2022 | FY 2021 | ||
|---|---|---|---|---|---|
| Medical Center, net | Medical Center, net | 3,780 | 3,431 | 3,088 | 2,759 |
| Grants and Contracts, net | Federal Grants and contracts | 513 | 499 | 469 | 435 |
| Federal Pell Grants | 61 | 55 | 57 | 58 | |
| State grants and contracts | 136 | 161 | 146 | 151 | |
| Private grants and contracts | 257 | 197 | 181 | 162 | |
| Local grants and contracts | 9 | 19 | 17 | 14 | |
| Student Tuition and Fees, net | Student Tuition and Fees, net | 813 | 775 | 768 | 722 |
| State Appropriations | State Appropriations | 540 | 547 | 536 | 367 |
| Federal Appropriations | Federal Appropriations | 1 | 21 | 142 | 117 |
| Private Gifts | 143 | 115 | 102 | 133 | |
| Other Revenues | Auxiliary Enterprises, net | 125 | 118 | 107 | 40 |
| Educational Activities, net | 676 | 588 | 546 | 510 | |
| Investment Income, net | 145 | 85 | 60 | 176 | |
| Other non-operating revenue | 114 | 65 | 18 | 22 | |
| Other operating revenues, net | 29 | 89 | 63 | 75 | |
| Total | 7,344 | 6,765 | 6,302 | 5,743 | |
Student tuition and fees
Systemwide Tuition and Fee Levels
Beginning in fall 2022, the University of California will keep systemwide student tuition and fees at a flat rate for up to six years beyond a student's first enrolled term. This plan will provide cost predictability for students. Annually, UCOP publishes the Systemwide Tuition and Fee Levels which can be found on the UCOP website.
Fees Charged at the Campus Level
Campus-based fees and other costs, such as housing and health insurance, are subject to change each year. An overview of campus-based fees can be found on the campus website.
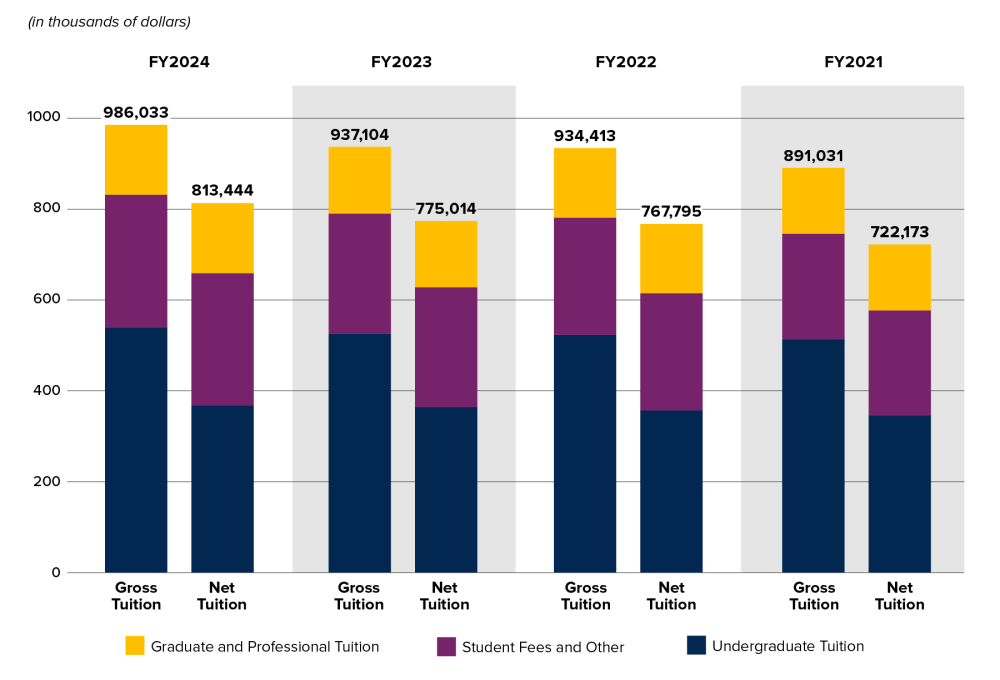
The difference between gross tuition and fees and net tuition is primarily scholarship allowances, including financial aid and fee waivers that are not paid directly to students.
| (in thousands of dollars) | FY 2024 | FY 2023 | FY 2022 | FY 2021 | ||||
|---|---|---|---|---|---|---|---|---|
| Tuition Type | Gross Tuition | Net Tuition | Gross Tuition | Net Tuition | Gross Tuition | Net Tuition | Gross Tuition | Net Tuition |
| Graduate and Professional | 154,104 | 154,220 | 146,770 | 146,770 | 152,771 | 152,771 | 144,857 | 144,857 |
| Student Fees and Other | 292,822 | 290,832 | 264,300 | 264,089 | 258,194 | 258,050 | 232,076 | 231,904 |
| Undergraduate Tuition | 539,107 | 368,392 | 526,034 | 364,155 | 523,447 | 356,974 | 514,098 | 345,412 |
| Grand Total | 986,033 | 813,444 | 937,104 | 775,014 | 934,413 | 767,795 | 891,031 | 722,173 |
Student enrollment and scholarship allowance
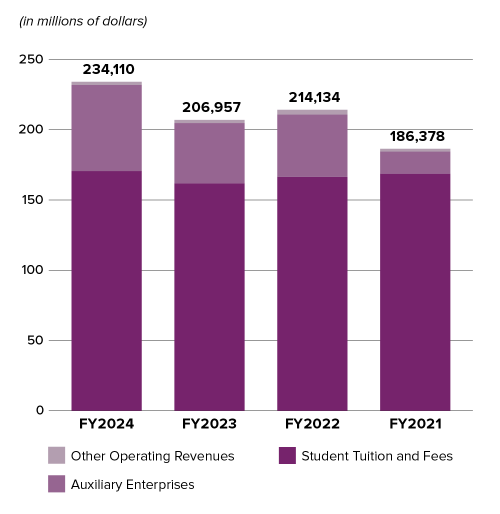
Scholarship allowance is the difference between the stated charge for tuition and fees and the amount that is paid by the student and third parties on behalf of the student. Scholarship allowance is netted against tuition and fees in the Statement of Revenues, Expenses, and Changes in Net Position.
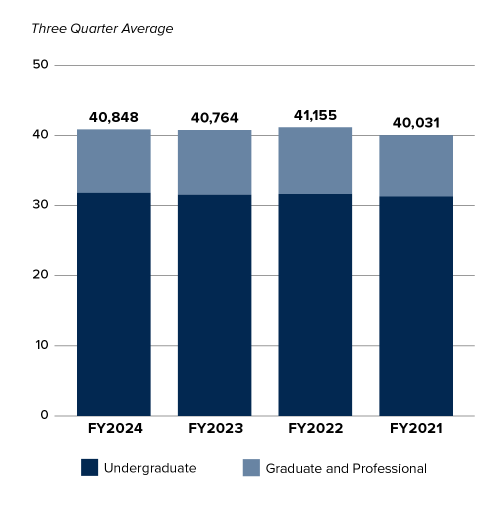
Student enrollment remained consistent in 2024 while scholarship allowance increased in 2024.
For more information regarding student enrollment, please visit the AggieData website.
Student Enrollment
| FY 2024 | FY 2023 | FY 2022 | FY 2021 | |
|---|---|---|---|---|
| Undergraduate | 31,797 | 31,532 | 31,657 | 31,293 |
| Graduate and Professional | 9,051 | 9,232 | 9,498 | 8,738 |
| Total | 40,848 | 40,764 | 41,155 | 40,031 |
Scholarship Allowance
| FY 2024 | FY 2023 | FY 2022 | FY 2021 | |
|---|---|---|---|---|
| Student tuition and fees | 170,599 | 161,879 | 166,473 | 168,686 |
| Auxiliary Enterprises | 61,294 | 42,807 | 44,336 | 15,716 |
| Other Operating Revenues | 2,217 | 2,270 | 3,324 | 1,976 |
| Total | 234,110 | 206,957 | 214,134 | 186,378 |
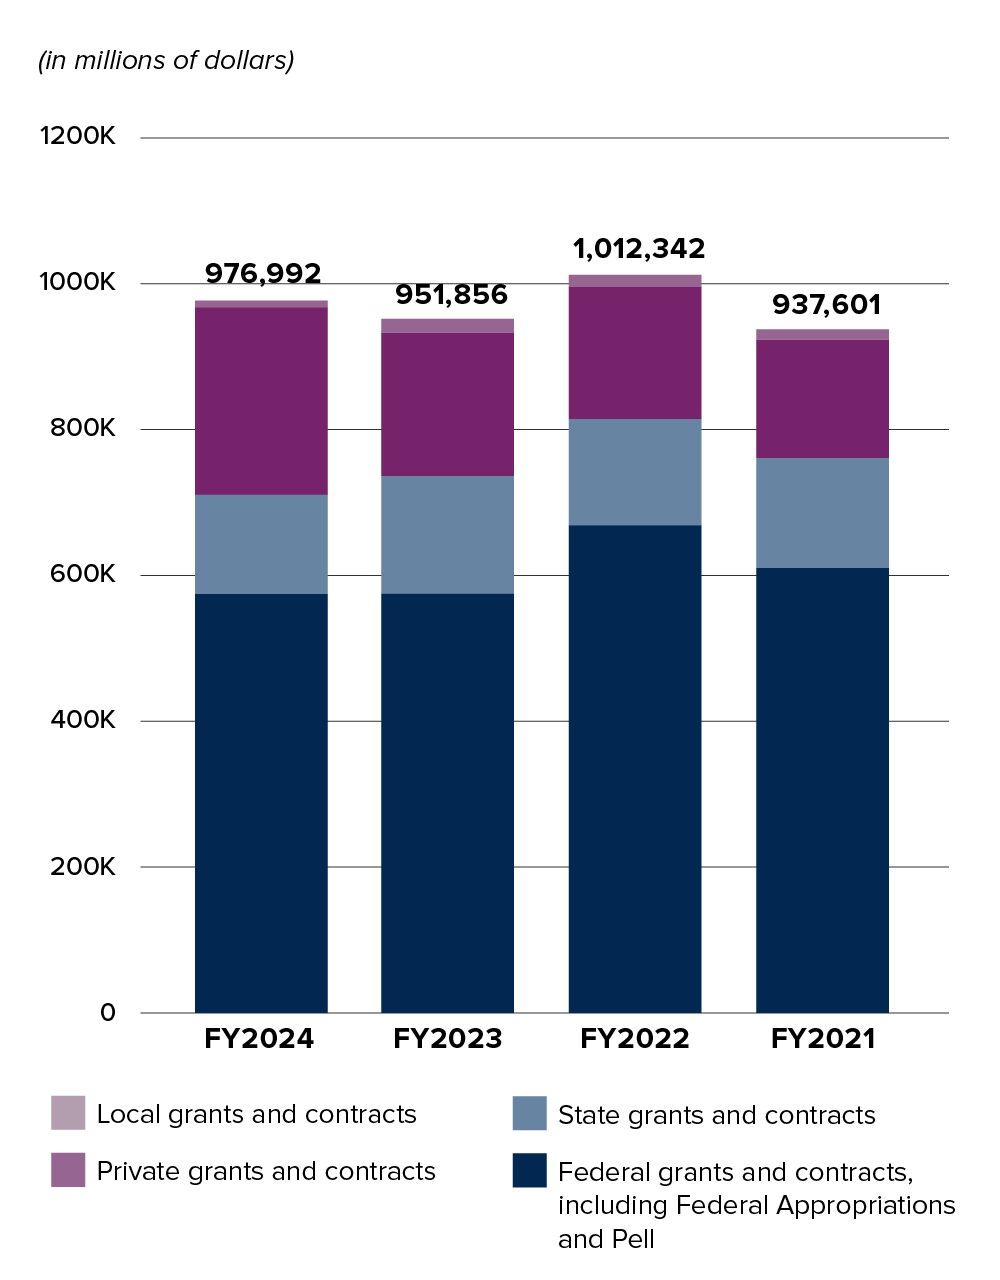
Contracts and grants
Revenue from federal, state, private, and local contracts and grants (including facilities and administration cost recoveries and Pell Grants) totaled $977 million in 2024, $952 million in 2023, and $1 billion in 2022.
The increase in contracts and grants revenue were driven by sponsored research projects.
The funds are crucial to helping UC Davis advance research in environmental sustainability and healthcare. To read more about the research being done at UC Davis, please refer to the UC Davis Office of Research Annual Report.
| FY 2024 | FY 2023 | FY 2022 | FY 2021 | |
|---|---|---|---|---|
| Federal Grants and contracts, including Federal Appropriations and Pell | 574,263 | 575,546 | 668,576 | 610,424 |
| State grants and contracts | 136,299 | 160,942 | 145,735 | 150,755 |
| Private grants and contracts | 256,943 | 196,646 | 180,983 | 162,250 |
| Local grants and contracts | 9,488 | 18,723 | 17,047 | 14,172 |
| Total | 976,992 | 951,856 | 1,012,342 | 937,601 |
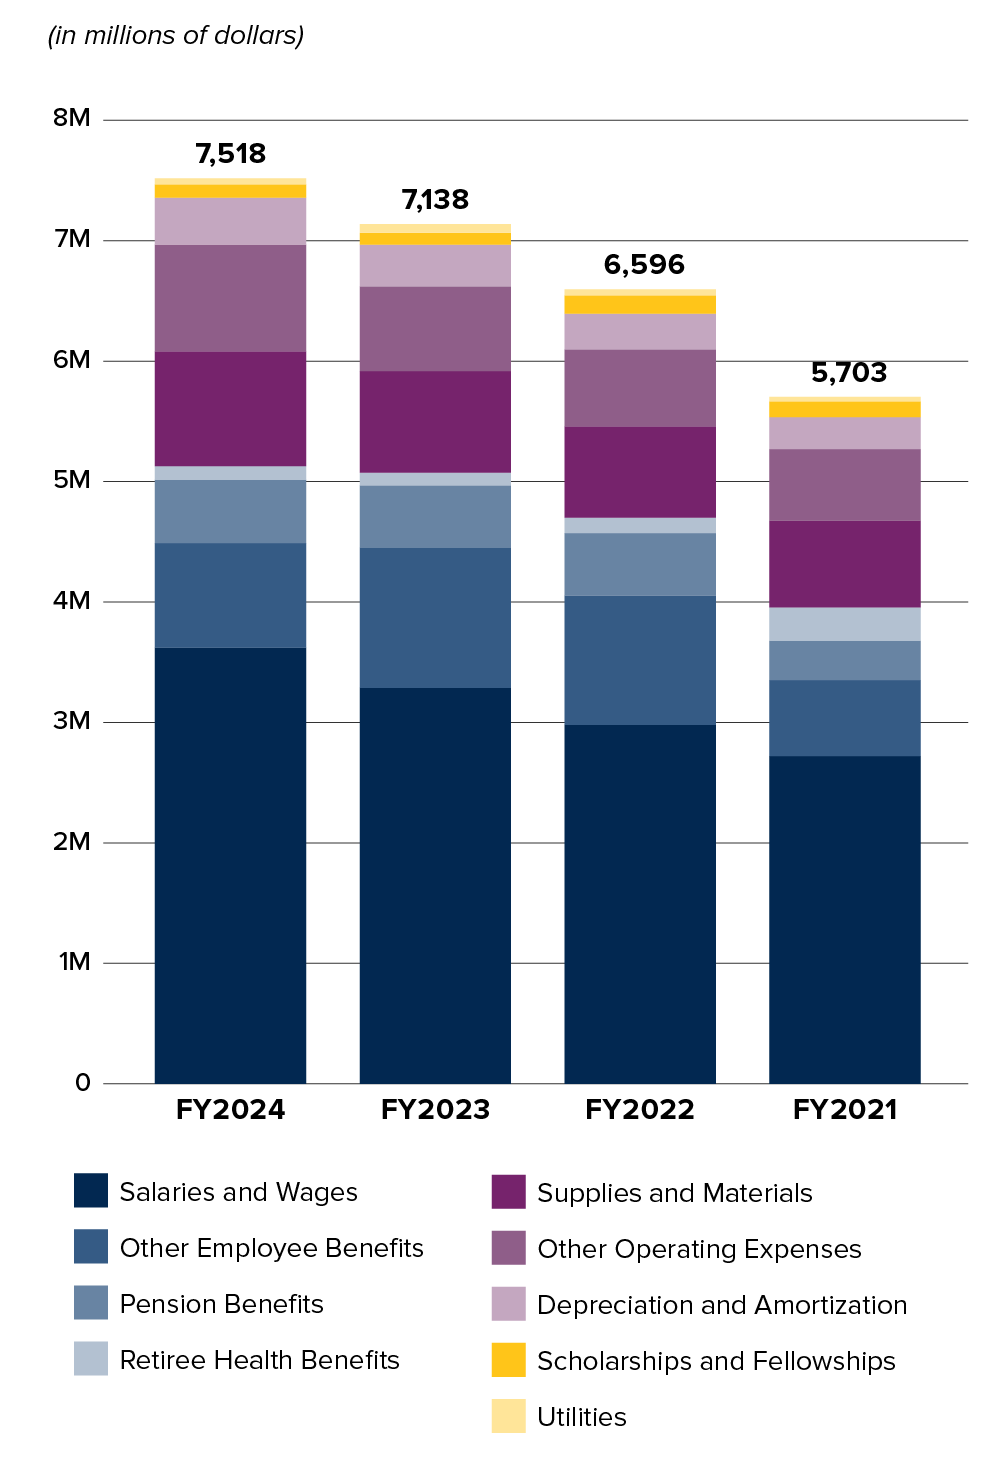
Operating expense by natural classification
UC Davis' operating expenses were $7.5 billion in 2024, $7.1 billion in 2023, and $6.6 billion in 2022.
COMPENSATION EXPENSES
Salaries and wages have been increasing due to growth in full-time equivalent employees (FTEs) and merit increases. Pension and retiree health benefits variances are driven by actuarial adjustments which are impacted by market fluctuations and discount rate assumptions.
NONCOMPENSATION OPERATING EXPENSES
Other operating expenses have increased proportional to revenue as well as due to inflation.
Depreciation and amortization has increased with the completion of capital projects as well with the adoption of GASB87 in FY22 and GASB96 in FY23.
| (in millions of dollars) | FY 2024 | FY 2023 | FY 2022 | FY 2021 | |
|---|---|---|---|---|---|
| Compensation Expense | Salaries and Wages | 3,622 | 3,288 | 2,980 | 2,721 |
| Pension Benefits | 526 | 518 | 518 | 326 | |
| Retiree Health Benefits | 113 | 107 | 129 | 278 | |
| Other Employee Benefits | 867 | 1,162 | 1,074 | 630 | |
| Total | 5,128 | 5,076 | 4,702 | 3,955 | |
| All Other Operating Expense | Scholarships and Fellowships | 109 | 99 | 151 | 130 |
| Utilities | 51 | 72 | 49 | 38 | |
| Supplies and Materials | 954 | 842 | 758 | 720 | |
| Depreciation and Amortization | 390 | 346 | 298 | 266 | |
| Other Operating Expenses | 886 | 704 | 638 | 594 | |
| Total | 2,390 | 2,063 | 1,894 | 1,748 | |
| Total | 7,518 | 7,138 | 6,596 | 5,703 | |
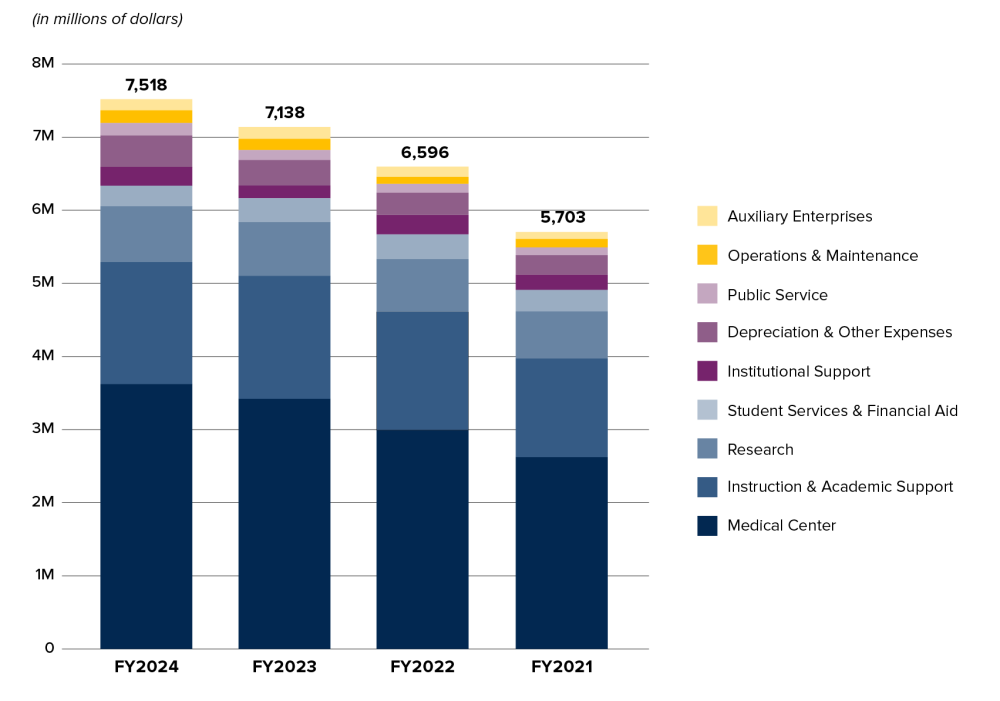
Operating expense by function
In addition to reporting expenses by natural expense type, universities present financial results based on function code. Understanding both sets of data are critical in evaluating financial results. Function codes are defined by the National Association of College and University Business Officers (NACUBO).
Overall, UC Davis' expenses have been increasing due to higher compensation expenses. The drivers behind the increase have been higher headcount, merit increases and changes in actuarial adjustments for pension and retiree health benefit expenses. Proportionally, the expenses by function code have stayed relatively consistent.
The percent of operating expenses spent by UC Davis Medical Center also increased in 2024 in relation to patient volume increases and operational growth
| (in millions of dollars) | FY 2024 | FY 2023 | FY 2022 | FY 2021 | ||||
|---|---|---|---|---|---|---|---|---|
| Expense | % of Total | Expense | % of Total | Expense | % of Total | Expense | % of Total | |
| Instruction & Academic Support | 1,670 | 22% | 1,684 | 24% | 1,619 | 25% | 1,353 | 24% |
| Research | 763 | 10% | 732 | 10% | 720 | 11% | 641 | 11% |
| Public Service | 170 | 2% | 137 | 2% | 122 | 2% | 107 | 2% |
| Student Services & Financial Aid | 281 | 4% | 329 | 5% | 341 | 5% | 295 | 5% |
| Institutional Support | 257 | 3% | 172 | 2% | 265 | 4% | 206 | 4% |
| Operations & Maintenance | 173 | 2% | 151 | 2% | 95 | 1% | 115 | 2% |
| Medical Center | 3,621 | 48% | 3,420 | 48% | 2,993 | 45% | 2,624 | 46% |
| Auxiliary Enterprises | 153 | 2% | 163 | 2% | 138 | 2% | 94 | 2% |
| Depreciation & Other Expenses | 430 | 6% | 350 | 5% | 303 | 5% | 268 | 5% |
| Total | 7,518 | 100% | 7,138 | 100% | 6,596 | 100% | 5,703 | 100% |